harmony 鸿蒙chart
chart
图表组件,用于呈现线形图、柱状图界面。
说明:
该组件从从API version 4 开始支持。后续版本如有新增内容,则采用上角标单独标记该内容的起始版本。
子组件
不支持。
属性
| 名称 | 类型 | 必填 | 描述 |
|---|---|---|---|
| type | string | 否 | 设置图表类型(不支持动态修改),可选项有: - bar:柱状图。 - line:线形图。 默认值:line |
| options | ChartOptions | 是 | 图表参数设置,柱状图和线形图必须设置参数设置。可以设置x轴、y轴的最小值、最大值、刻度数、是否显示,线条宽度、是否平滑等。(不支持动态修改) |
| datasets | Array<ChartDataset> | 是 | 数据集合,柱状图和线形图必须设置数据集合。可以设置多条数据集及其背景色。 |
| id | string | 否 | 组件的唯一标识。 |
| style | string | 否 | 组件的样式声明。 |
| class | string | 否 | 组件的样式类,用于引用样式表。 |
| ref | string | 否 | 用来指定指向子元素的引用信息,该引用将注册到父组件的$refs 属性对象上。 |
表1 ChartOptions
| 名称 | 类型 | 必填 | 描述 |
|---|---|---|---|
| xAxis | ChartAxis | 是 | x轴参数设置。可以设置x轴最小值、最大值、刻度数以及是否显示。 |
| yAxis | ChartAxis | 是 | y轴参数设置。可以设置y轴最小值、最大值、刻度数以及是否显示。 |
| series | ChartSeries | 否 | 数据序列参数设置。可以设置: 1. 线的样式,如线宽、是否平滑; 2. 设置线最前端位置白点的样式和大小。 说明: 仅线形图支持。 |
表2 ChartDataset
| 名称 | 类型 | 默认值 | 必填 | 描述 |
|---|---|---|---|---|
| backgroundColor(deprecated) | <color> | #ff6384 | 否 | 设置线或柱的颜色(不推荐使用)。 |
| strokeColor | <color> | #ff6384 | 否 | 线条颜色。仅线形图支持。 |
| fillColor | <color> | #ff6384 | 否 | 填充颜色。线形图表示填充的渐变颜色。 |
| data | Array<number> | - | 是 | 设置绘制线或柱中的点集。 |
| gradient | boolean | false | 否 | 设置是否显示填充渐变颜色。仅线形图支持。 |
表3 ChartAxis
| 名称 | 类型 | 默认值 | 必填 | 描述 |
|---|---|---|---|---|
| min | number | 0 | 否 | 轴的最小值。 不支持负数。仅线形图支持。 |
| max | number | 100 | 否 | 轴的最大值。 不支持负数。仅线形图支持。 |
| axisTick | number | 10 | 否 | 轴显示的刻度数量。 说明: 仅支持1~20,且具体显示的效果与如下计算值有关(图的宽度所占的像素/(max-min))。 因轻量级智能穿戴为整型运行,在除不尽的情况下会有误差产生,具体的表现形式是x轴末尾可能会空出一段。 在柱状图中,每组数据显示的柱子数量与刻度数量一致,且柱子显示在刻度处。 |
| display | boolean | false | 否 | 是否显示轴。 |
| color | <color> | #c0c0c0 | 否 | 轴颜色。 |
表4 ChartSeries
| 名称 | 类型 | 必填 | 描述 |
|---|---|---|---|
| lineStyle | ChartLineStyle | 否 | 线样式设置,如线宽、是否平滑。 |
| headPoint | PointStyle | 否 | 线最前端位置白点的样式和大小。 |
| topPoint | PointStyle | 否 | 最高点的样式和大小。 |
| bottomPoint | PointStyle | 否 | 最低点的样式和大小。 |
| loop | ChartLoop | 否 | 设置屏幕显示满时,是否需要重头开始绘制。 |
表5 ChartLineStyle
| 名称 | 类型 | 默认值 | 必填 | 描述 |
|---|---|---|---|---|
| width | <length> | 1px | 否 | 线宽设置。 |
| smooth | boolean | false | 否 | 是否平滑。 |
表6 PointStyle
| 名称 | 类型 | 默认值 | 必填 | 描述 |
|---|---|---|---|---|
| shape | string | circle | 否 | 高亮点的形状。可选值为: - circle:圆形。 |
| size | <length> | 5px | 否 | 高亮点的大小。 |
| strokeWidth | <length> | 1px | 否 | 边框宽度 |
| strokeColor | <color> | #ff0000 | 否 | 边框颜色。 |
| fillColor | <color> | #ff0000 | 否 | 填充颜色。 |
| display | boolean | true | 否 | 是否高亮显示。 |
表7 ChartLoop
| 名称 | 类型 | 默认值 | 必填 | 描述 |
|---|---|---|---|---|
| margin | <length> | 1 | 否 | 擦除点的个数(最新绘制的点与最老的点之间的横向距离)。注意:轻量设备margin和topPoint/bottomPoint/headPoint同时使用时,有概率出现point正好位于擦除区域的情况,导致point不可见,因此不建议同时使用。 |
方法
| 方法 | 参数 | 描述 |
|---|---|---|
| append | { serial: number, // 设置要更新的线形图数据下标 data: Array<number>, // 设置新增的数据 } |
往已有的数据序列中动态添加数据,根据serial指定目标序列,serial为datasets数组的下标,从0开始。注意:不会更新datasets[index].data。仅线形图支持,按横坐标加1递增(与xAxis min/max设置相关)。 |
事件
| 名称 | 参数 | 描述 |
|---|---|---|
| click | - | 点击动作触发该事件。 |
| longpress | - | 长按动作触发该事件。 |
| swipe5+ | SwipeEvent | 组件上快速滑动后触发。 |
样式
| 名称 | 类型 | 默认值 | 必填 | 描述 |
|---|---|---|---|---|
| width | <length> | <percentage>5+ | - | 否 | 设置组件自身的宽度。 未设置时组件宽度默认为0。 |
| height | <length> | <percentage>5+ | - | 否 | 设置组件自身的高度。 未设置时组件高度默认为0。 |
| padding | <length> | 0 | 否 | 使用简写属性设置所有的内边距属性。 该属性可以有1到4个值: - 指定一个值时,该值指定四个边的内边距。 - 指定两个值时,第一个值指定上下两边的内边距,第二个指定左右两边的内边距。 - 指定三个值时,第一个指定上边的内边距,第二个指定左右两边的内边距,第三个指定下边的内边距。 - 指定四个值时分别为上、右、下、左边的内边距(顺时针顺序)。 |
| padding-[left|top|right|bottom] | <length> | 0 | 否 | 设置左、上、右、下内边距属性。 |
| margin | <length> | <percentage>5+ | 0 | 否 | 使用简写属性设置所有的外边距属性,该属性可以有1到4个值。 - 只有一个值时,这个值会被指定给全部的四个边。 - 两个值时,第一个值被匹配给上和下,第二个值被匹配给左和右。 - 三个值时,第一个值被匹配给上, 第二个值被匹配给左和右,第三个值被匹配给下。 - 四个值时,会依次按上、右、下、左的顺序匹配 (即顺时针顺序)。 |
| margin-[left|top|right|bottom] | <length> | <percentage>5+ | 0 | 否 | 设置左、上、右、下外边距属性。 |
| border-width | <length> | 0 | 否 | 使用简写属性设置元素的所有边框宽度。 |
| border-color | <color> | black | 否 | 使用简写属性设置元素的所有边框颜色。 |
| border-radius | <length> | - | 否 | border-radius属性是设置元素的外边框圆角半径。 |
| background-color | <color> | - | 否 | 设置背景颜色。 |
| display | string | flex | 否 | 确定一个元素所产生的框的类型,可选值为: - flex:弹性布局。 - none:不渲染此元素。 |
| [left|top] | <length> | <percentage>6+ | - | 否 | left|top确定元素的偏移位置。 - left属性规定元素的左边缘。该属性定义了定位元素左外边距边界与其包含块左边界之间的偏移。 - top属性规定元素的顶部边缘。该属性定义了一个定位元素的上外边距边界与其包含块上边界之间的偏移。 |
示例
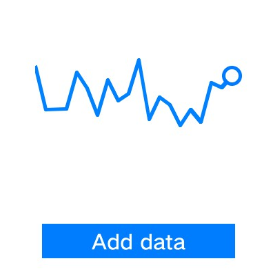
- 线形图
   <!-- xxx.hml -->
   <div class="container">
     <chart class="chart" type="line" ref="linechart" options="{{lineOps}}" datasets="{{lineData}}"></chart>
     <input class="button" type="button" value="Add data" onclick="addData"/>
   </div>
   /* xxx.css */
   .container {
     flex-direction: column;
     justify-content: center;
     align-items: center;
     width: 454px;
     height: 454px;
     background-color: white;
   }
   .chart {
     width: 300px;
     height: 300px;
   }
   .button {
     width: 280px;
     border-radius: 0px;
   }
   // xxx.js
   export default {
     data: {
       lineData: [
         {
           strokeColor: '#0081ff',
           fillColor: '#cce5ff',
           data: [763, 550, 551, 554, 731, 654, 525, 696, 595, 628, 791, 505, 613, 575, 475, 553, 491, 680, 657, 716],
           gradient: false,
         }
       ],
       lineOps: {
         xAxis: {
           min: 0,
           max: 20,
           display: false,
         },
         yAxis: {
           min: 0,
           max: 1000,
           display: false,
         },
         series: {
           lineStyle: {
             width: "5px",
             smooth: true,
           },
           headPoint: {
             shape: "circle",
             size: 10,
             strokeWidth: 5,
             fillColor: '#ffffff',
             strokeColor: '#007aff',
             display: true,
           },
           loop: {
             margin: 2,
             gradient: true,
           }
         }
       },
     },
     addData() {
       this.$refs.linechart.append({
         serial: 0,
         data: [Math.floor(Math.random() * 400) + 400]
       })
     }
   }
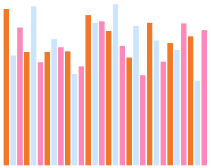
- 柱状图
   <!-- xxx.hml -->
   <div class="container">
     <chart class="chart" type="bar" id="bar-chart" options="{{barOps}}" datasets="{{barData}}"></chart>
   </div>
   /* xxx.css */
   .container {
     flex-direction: column;
     justify-content: center;
     align-items: center;
     width: 454px;
     height: 454px;
     background-color: white;
   }
   .chart {
     width: 300px;
     height: 300px;
   }
   // xxx.js
   export default {
     data: {
       barData: [
         {
           fillColor: '#f07826',
           data: [763, 550, 551, 554, 731, 654, 525, 696, 595, 628],
         },
         {
           fillColor: '#cce5ff',
           data: [535, 776, 615, 444, 694, 785, 677, 609, 562, 410],
         },
         {
           fillColor: '#ff88bb',
           data: [673, 500, 574, 483, 702, 583, 437, 506, 693, 657],
         },
       ],
       barOps: {
         xAxis: {
           min: 0,
           max: 20,
           display: false,
           axisTick: 10
         },
         yAxis: {
           min: 0,
           max: 1000,
           display: false,
         },
       },
     }
   }
你可能感兴趣的鸿蒙文章
0
赞
- 所属分类: 后端技术
- 本文标签:
热门推荐
-
2、 优质文章
-
3、 gt
-
7、 openharmony
-
9、 golang
-
10、 Vue中input框自动聚焦